


Plugin Lists
15 Interactive Charts WordPress Plugins for Data Visualization
Data science is a fast growing field these days. You don’t have to be a data scientist to appreciate the benefits of displaying interactive charts and infographics on your site. Here are 15 interactive chart plugins that help you offer more value to your readers:
Top Interactive Charts Plugins for WordPress
Premium Charts for Elementor: this plugin supports 7 chart types, including linear and logarithmic charts. Everything happens inside Elementor to make your life easier.
UberChart: this responsive chart plugin comes with 240 options per chart. It supports 10 chart types and has a spreadsheet editor for copying and adding data.

Chartli: this interactive chart plugin supports over 50 types of graphs. It is responsive and ready for retina displays.
WooCommerce Interactive Reporting: a powerful plugin for WooCommerce webmasters. It helps you visualize sales data and filter it by product, customer, currency, shipping method, and other fields.

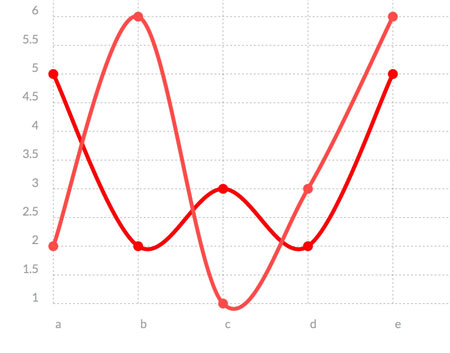
MaxiCharts: lets you turn Gravity Forms submissions or CSV data into beautiful Charts.JS charts.
Interactive Financial Charts: this plugin takes advantage of Quandl to create responsive financial charts for your site. It supports line, smoothed line, column, and step chart types.

Easy Org Chart: a free plugin that lets you create organizational charts for your business.
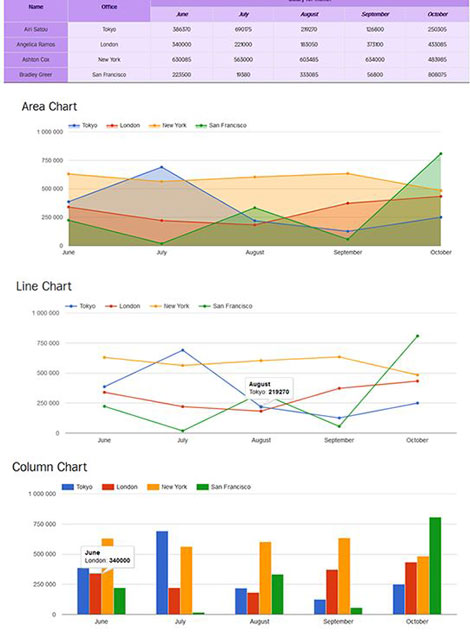
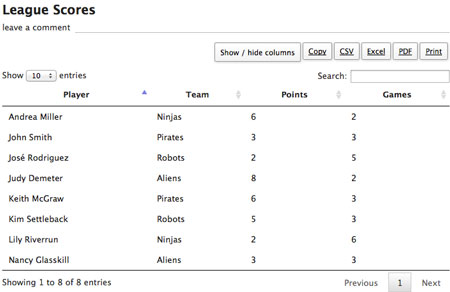
Data Tables Generator: this chart plugin lets you create and manage tables from the back-end. It lets you turn your data into interactive graphs and diagrams. Tables can be exported in 3 different formats. Offers Google Charts integration.
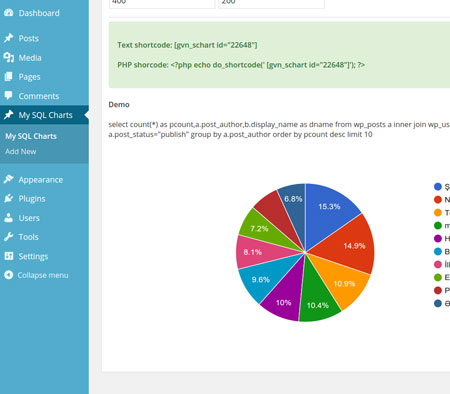
SQL Chart Builder: lets you use SQL queries to create beautiful charts. Supports pie, donut, line, bar, column, and area charts.
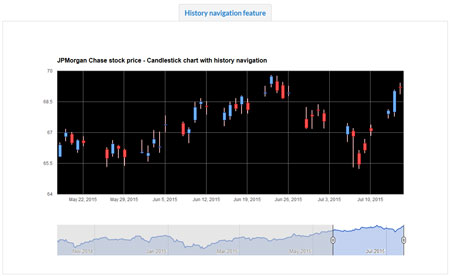
Dynamic Stock Charts: this interactive charts plugin helps you make sense of the stocks. It lets you display an unlimited number of charts on one page. It is built with Google Charts API.
Chartist: an extension for TablePress that uses Chartist.js to create responsive charts based on your data.
Coin Market Cap & Prices: a beautiful plugin that displays live crypto prices, market cap, price graphs, and other relevant data on your site. It covers a list of over 17000 crypto coins.
Inline Google Spreadsheet Viewer: lets you use data in your spreadsheet, CSV file, or MySQL database to create beautiful charts. It can also display online documents in your posts.
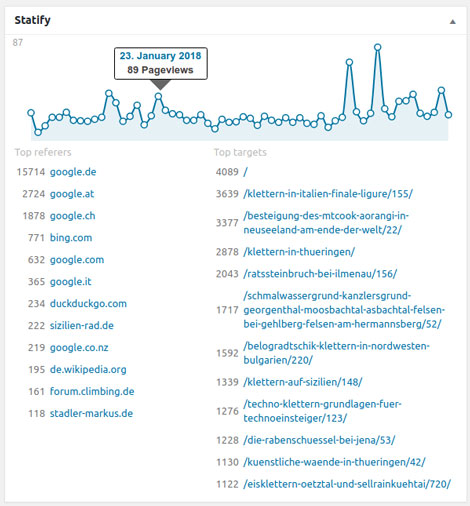
Statify: visualizes your website views, showing you top targets and referrers. It also puts your pageviews on a chart.
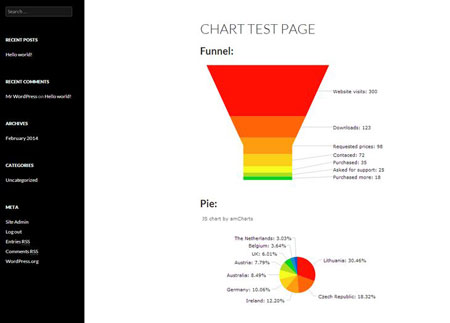
amCharts: this plugin lets you create and display JavaScript based charts to your site.
Have you found better interactive charts plugins for WordPress? Please share them here.