


Wordpress Plugins
Visualizer: Tables and Charts WordPress Plugin
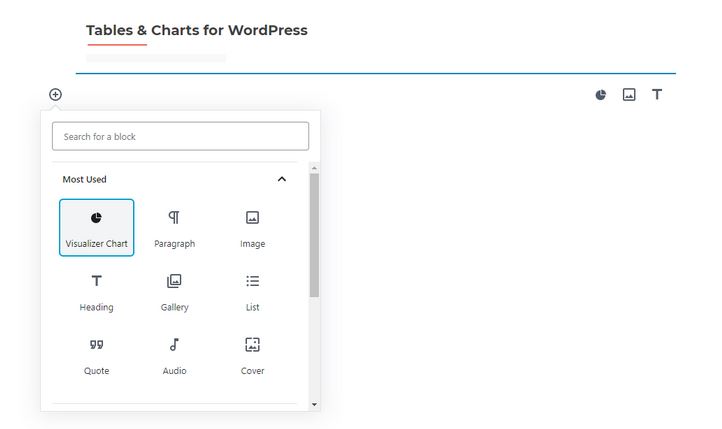
You don’t have to be a professional data scientist to appreciate the usefulness of tables and charts in helping people making sense any set of data. Visualizer for WordPress is a handy plugin that lets you create and manage interactive charts and tables in your posts and pages.
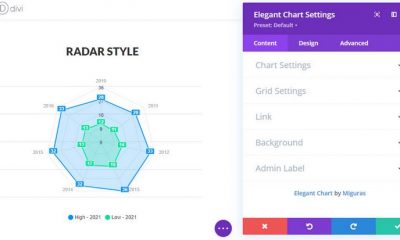
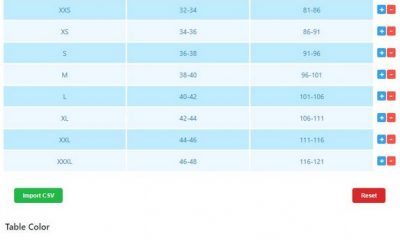
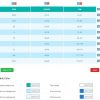
This plugin supports 9 chart types right off the bat with more available in the pro version. It lets you add line, area, bar, column, pie, geography, table, bubble, and scatter charts. This plugin also lets you add responsive tables to your pages with sorting and search function. It renders charts with HTML5/SVG to ensure maximum compatibility.
The pro version of this plugin brings candlestick, timeline, gauge, and more advanced charts to your site. Admins can also make it possible for their visitors to edit charts.